
Cost of goods sold (COGS) is the total direct cost of producing or purchasing the goods a business sells during an accounting period, calculated as: Beginning inventory + Purchases − Ending inventory = COGS. COGS appears on the income statement directly below revenue, and the difference between the two is gross profit.
- Beginning inventory: the dollar value of stock on hand at the start of the period
- Purchases: all inventory bought or manufactured during the period, net of returns
- Ending inventory: the dollar value of stock remaining unsold at period end
- COGS: what you subtract from revenue to reach gross profit
Table of Contents
- What does cost of goods sold mean for your profitability?
- Which costs belong in COGS and which do not?
- How do you calculate COGS step by step?
- How do inventory valuation methods change your COGS?
- How does COGS differ from operating expenses, and why does it affect your margins?
- How do service businesses handle cost of goods sold?
- What are the most common COGS mistakes and how do you fix them?
- A worked numeric example you can replicate in a spreadsheet
- U.S. GAAP, IRS rules, and when to call an accountant
- What does rising COGS usually signal?
- Key Takeaways
- Why small-business owners should treat COGS as a management tool, not just a tax line
- Authoritative references and further reading
What does cost of goods sold mean for your profitability?
COGS covers only the direct costs tied to goods actually sold. Raw materials, direct labor on the production floor, and production-related overhead all belong here. What does not belong: sales salaries, advertising, office rent, and general administrative costs. Those are operating expenses, and mixing them with COGS distorts the gross profit figure that investors, lenders, and pricing models all depend on.
Tracking COGS accurately matters for four concrete reasons:
- Tax reporting: — The IRS allows businesses to deduct COGS from gross receipts, reducing taxable income. The method you use to value inventory determines how large that deduction is.
Under U.S. GAAP, COGS is a line item on the income statement. Gross margin, the ratio of gross profit to revenue, is one of the first metrics analysts examine when assessing a company’s financial health. For small-business owners, it is equally telling: a shrinking gross margin almost always points back to rising COGS or flat pricing.
Which costs belong in COGS and which do not?
Getting this classification right is one of the most practical skills in small-business accounting. NetSuite’s financial-management guidance is direct on this point: misclassifying overhead as COGS inflates reported costs and understates gross profit, which leads to poor pricing and growth decisions.
Costs that belong in COGS:
- Direct raw materials and components used in production
- Direct labor paid to workers who physically make or assemble the product
- Manufacturing overhead directly tied to production (factory utilities, equipment depreciation on production machinery)
- Freight-in costs to receive inventory at your facility
- Packaging costs that are part of the product itself
- Import duties and tariffs on purchased inventory
Costs that do not belong in COGS:
- Selling, general, and administrative (SG&A) expenses
- Marketing and advertising spend (these are period costs, not product costs)
- Office rent unless the space is exclusively a production facility
- Administrative salaries and executive compensation
- Outbound shipping and distribution costs not tied to specific units
- Interest expense and bank fees
The distinction shifts by industry. A retailer’s COGS is primarily the wholesale cost of merchandise plus freight-in. A manufacturer adds direct labor and factory overhead. A wholesaler’s COGS is the purchase price of goods plus inbound freight. Each model has a different cost structure, but the rule stays the same: if the cost disappears when you stop making or buying that specific product, it likely belongs in COGS.
Pro Tip: Pulling rent or administrative salaries into COGS to lower taxable income is a common temptation, but it artificially deflates gross margin. When you later try to price a new product or pitch to investors, the distorted margin will work against you.
How do you calculate COGS step by step?
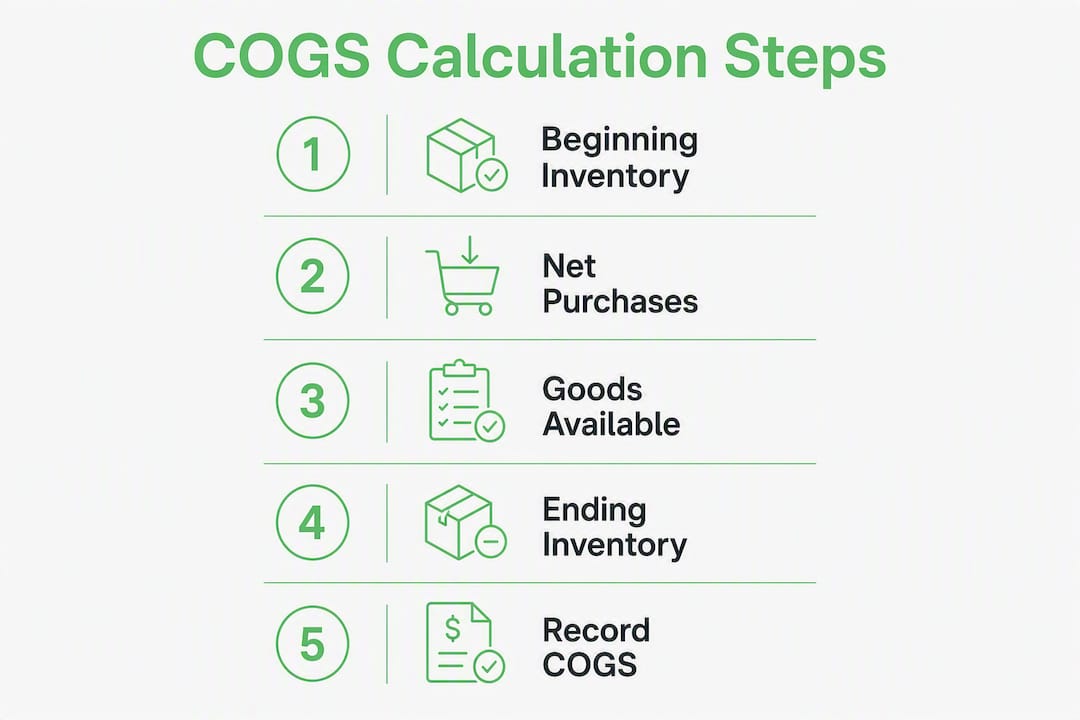
The standard formula is straightforward. The discipline is in gathering accurate inputs.
Step 1: Determine beginning inventory.
Pull the ending inventory balance from the prior period’s balance sheet. This becomes your opening figure for the current period.

Step 2: Add net purchases.
Sum all inventory purchased or manufactured during the period. Subtract purchase returns, allowances, and vendor discounts to arrive at net purchases.
Step 3: Calculate goods available for sale.
Beginning inventory + Net purchases = Goods available for sale. This is the total pool of inventory that could have been sold.
Step 4: Subtract ending inventory.
Conduct a physical count or use your inventory system to determine what remains unsold at period end. Subtract this from goods available for sale.
Step 5: Record the result as COGS.
The remainder is the cost of goods sold for the period.
Sample journal entries (periodic inventory system):
When you purchase inventory on account:
Dr. Purchases          $50,000
   Cr. Accounts Payable          $50,000
At period end, to close out beginning inventory and record COGS:
Dr. COGS               $XX,XXX
Dr. Ending Inventory   $XX,XXX
   Cr. Beginning Inventory       $XX,XXX
   Cr. Purchases                 $XX,XXX
Timing matters. COGS is a period cost: it covers only what was sold within that accounting period. Inventory purchased but not yet sold stays on the balance sheet as an asset. If a shipment arrives on the last day of the month but the goods are not yet counted, they must still be included in ending inventory. Cutoff errors, where purchases straddle period boundaries, are among the most common sources of COGS inaccuracy.
Inventory shrinkage (theft, damage, spoilage) is typically charged directly to COGS when discovered, which reduces gross profit. Some businesses carry a separate shrinkage line, but the effect on the income statement is the same.
How do inventory valuation methods change your COGS?
The method you use to assign costs to units sold directly affects reported COGS, gross profit, and taxable income. Xero’s accounting guides note that many businesses favor FIFO because it often reflects the physical flow of goods, but the choice has real financial consequences, especially when input costs are moving.
FIFO (First In, First Out): Assumes the oldest inventory is sold first. In a rising-cost environment, FIFO assigns lower, older costs to COGS and leaves higher-cost units in ending inventory. The result is higher reported gross profit and higher taxable income.

LIFO (Last In, First Out): Assumes the newest inventory is sold first. In a rising-cost environment, LIFO assigns higher, recent costs to COGS, reducing gross profit and taxable income. IRS Publication 538 governs LIFO adoption in the U.S., and the method requires strict compliance and consistent application. LIFO is not permitted under IFRS, so U.S. companies using it cannot easily compare financials with international peers.
Weighted average cost: Divides the total cost of goods available for sale by the total number of units. This smooths out price fluctuations and produces a COGS figure between FIFO and LIFO in most environments.
Specific identification: Tracks the actual cost of each individual unit. Used for high-value, low-volume goods such as vehicles, jewelry, or custom equipment. Serialized inventory tracking is the practical mechanism that makes specific identification feasible at scale.
| Method | Rising costs: COGS | Rising costs: Gross profit | Rising costs: Tax liability |
|---|---|---|---|
| FIFO | Lower | Higher | Higher |
| LIFO | Higher | Lower | Lower |
| Weighted average | Middle | Middle | Middle |
| Specific identification | Actual cost | Actual cost | Actual cost |
In a falling-cost environment, the effects reverse: FIFO produces higher COGS and lower gross profit, while LIFO produces lower COGS and higher gross profit.
For most small businesses, FIFO is the practical default. It aligns with how physical inventory typically moves, it is accepted under both U.S. GAAP and IFRS, and it requires less complex recordkeeping. If you are considering LIFO specifically to reduce taxable income, consult a CPA before adopting it. The IRS requires a Form 970 election and imposes specific recordkeeping rules that add compliance cost.
How does COGS differ from operating expenses, and why does it affect your margins?
COGS and operating expenses (opex) both reduce net income, but they do so at different levels of the income statement. COGS is subtracted from revenue to produce gross profit. Operating expenses, including rent, salaries, and marketing costs, are subtracted from gross profit to produce operating income.
The distinction matters because gross margin isolates production efficiency. A business with a 60% gross margin but high opex may still be profitable. A business with a 20% gross margin has very little room to cover fixed costs before reaching breakeven.
Key metrics to track monthly:
- Gross profit: Revenue − COGS
- Gross margin %: (Gross profit ÷ Revenue) × 100
- COGS as % of revenue: COGS ÷ Revenue × 100
- COGS trend: Month-over-month change in COGS relative to revenue
A rising COGS-to-revenue ratio is a diagnostic signal. Investopedia’s analysis puts it precisely: a rising ratio often signals supply-chain inefficiencies, excessive labor usage, or outdated production methods that need management attention. Catching this trend monthly gives you time to act before it compresses margins to the point where pricing changes become unavoidable.
How do service businesses handle cost of goods sold?
Service companies do not carry physical inventory, but they still have direct costs tied to delivering each client engagement. The correct term is cost of services sold, and AccountingTools is clear that treating direct professional time and client-specific third-party costs as cost of services sold reveals real project margins that standard reports often hide.
Costs that qualify as cost of services sold for a service firm:
- Direct labor: billable hours worked by employees or contractors on a specific project
- Subcontractor fees paid for work on a specific client engagement
- Project-specific software licenses or platform fees
- Direct travel costs billed to a client project
- Third-party tools purchased specifically to deliver a client deliverable
Example: A digital agency takes on a web development project. The project requires 40 hours of developer time at $75/hour ($3,000), a $200 hosting setup fee, and $500 in subcontractor design work. Cost of services sold for that project: $3,750. If the project billed at $6,000, gross profit is $2,250, a 37.5% gross margin.
Practical tools for capturing these costs include time-tracking software (Harvest, Toggl Track), project management platforms with cost-tagging (Asana, Monday.com), and accounting software with job-costing features (QuickBooks Online, Xero). The key discipline is tagging each expense to a specific project at the time it is incurred, not reconstructing it at month end.
Pro Tip: Many service businesses discover their least profitable clients only after setting up project-level cost tracking. A client that generates high revenue but requires extensive subcontractor support and revision cycles may carry a lower margin than a smaller, simpler engagement.
What are the most common COGS mistakes and how do you fix them?
Inaccurate COGS flows directly into inaccurate gross profit, which affects every pricing and investment decision downstream. Square’s small-business guidance makes the point plainly: beginning and ending inventory figures determine what was actually sold during the period, so errors in those counts produce errors in COGS.
Common errors to watch for:
- Misclassifying SG&A or overhead as COGS (inflates COGS, understates gross profit)
- Skipping physical inventory counts and relying solely on book balances
- Ignoring freight-in costs, which are a legitimate component of inventory cost
- Double-counting purchases when invoices are entered more than once
- Failing to match costs to the correct period (cutoff errors)
- Not adjusting COGS for shrinkage, spoilage, or obsolescence
Internal controls that prevent these errors:
- Conduct physical inventory counts at least quarterly; reconcile to the general ledger after each count
- Require purchase orders and receiving reports before entering vendor invoices
- Segregate purchasing, receiving, and accounting duties among different staff members
- Reconcile accounts payable to inventory receipts monthly
- Set up a separate shrinkage or write-off account so adjustments are visible
Pro Tip: When your physical count differs from your book inventory, do not simply adjust the balance sheet without investigating. A recurring variance often points to a process problem, such as unrecorded returns, theft, or a data-entry error in the purchasing workflow, that will keep producing inaccurate COGS until it is fixed.
A worked numeric example you can replicate in a spreadsheet
The following example uses a small retailer to show the full calculation, then adapts it for a service project.
Retail example
Spreadsheet formula equivalents (Excel / Google Sheets):
- Goods available for sale:
=B2+B4(beginning inventory + net purchases) - COGS:
=B6-B7(goods available for sale − ending inventory) - Gross profit:
=B9-B8(revenue − COGS) - Gross margin %:
=B10/B9*100
Service project example
| Input | Value |
|---|---|
| Developer hours (40 hrs × $75) | $3,000 |
| Subcontractor design fee | $500 |
| Hosting setup | $200 |
| Project revenue | $6,000 |
| Gross margin % | a bit over one-third |
For monthly reporting, reset beginning inventory to the prior month’s ending balance. For quarterly or annual periods, the same logic applies: the period simply spans more transactions. Omniconvert’s COGS calculator guide recommends building a separate tab for each period so you can track COGS trends over time without overwriting prior data.
U.S. GAAP, IRS rules, and when to call an accountant
Under U.S. GAAP, inventory is reported on the balance sheet at cost, and COGS is recognized on the income statement in the period the related goods are sold. This matching principle, cost recognized when revenue is recognized, is the foundation of accrual accounting.
The IRS treats COGS as a deduction from gross receipts when calculating taxable income. IRS Publication 538 covers inventory accounting methods in detail, including the rules for LIFO adoption, the LIFO conformity requirement (if you use LIFO for taxes, you must use it for financial reporting too), and the recordkeeping standards the IRS expects.
Situations that warrant a CPA consultation:
- You are considering adopting LIFO to reduce taxable income
- You want to change your existing inventory valuation method (method changes require IRS approval via Form 3115)
- Your physical count reveals a material variance from book inventory
- You operate in multiple states with different sales tax or income tax rules
- Your business is growing and you are moving from cash-basis to accrual accounting
Pro Tip: Changing inventory methods is not a simple bookkeeping update. The IRS treats it as an accounting method change, which requires a formal application and may result in a Section 481(a) adjustment that affects taxable income in the year of change. Get professional guidance before making the switch.
This article provides general information about COGS and U.S. accounting practices. It is not tax or legal advice. Confirm current rules with the IRS or a qualified CPA before making accounting or tax decisions.
What does rising COGS usually signal?
A rising COGS-to-revenue ratio is one of the clearest early-warning signals in financial management. It rarely appears without a cause, and the cause is almost always one of four things: supplier price increases, labor inefficiency, inventory shrinkage, or a shift in product mix toward lower-margin items.
Diagnostic checklist for rising COGS:
- Supplier pricing: Compare current unit costs to the same period last year. A 5% increase in material costs on a high-volume product can move COGS significantly.
- Labor hours per unit: If production labor hours per unit are rising, look at staffing levels, overtime, and process bottlenecks.
- Inventory shrinkage: A growing gap between book and physical inventory suggests theft, spoilage, or recording errors.
- Product mix: If lower-margin products are growing as a share of total sales, overall COGS as a percentage of revenue rises even if individual product costs are flat.
- Freight-in costs: Rising inbound shipping rates are often overlooked but flow directly into COGS for businesses that include freight-in in inventory cost.
Pro Tip: Prioritize your investigation by margin impact. Calculate how much each potential cause would need to change to account for the observed COGS increase. A 10% rise in freight-in costs on a product that represents 5% of revenue has a smaller impact than a 3% rise in direct labor on your top-selling line.
Key Takeaways
Accurate COGS calculation requires the right formula, the right cost classifications, a reliable inventory count, and a valuation method that fits your business and tax situation.
| Point | Details |
|---|---|
| Core formula | Beginning inventory + Purchases − Ending inventory = COGS; appears on the income statement above gross profit. |
| Include vs. exclude | Direct materials, labor, and production overhead belong in COGS; marketing, admin, and SG&A do not. |
| Valuation method impact | FIFO, LIFO, and weighted average produce different COGS figures; method choice affects gross profit and taxable income. |
| Physical counts are non-negotiable | Inaccurate inventory counts produce inaccurate COGS and distort every profitability metric downstream. |
| When to consult a CPA | Adopting LIFO, changing methods, or facing a material inventory variance all require professional guidance. |
Why small-business owners should treat COGS as a management tool, not just a tax line
Most small-business owners encounter COGS for the first time on a tax return or an accountant’s income statement. That framing, COGS as a compliance figure, undersells what it actually does. A well-maintained COGS calculation is one of the most direct windows into whether a business is running efficiently.
The owners who get the most value from COGS are not the ones who calculate it once a year for their CPA. They are the ones who review gross margin monthly, tag every project expense at the time it is incurred, and treat a rising COGS-to-revenue ratio as a prompt to investigate, not a number to accept. For product businesses, that means quarterly physical counts and a clean separation between direct and indirect costs. For service businesses, it means project-level cost tracking from day one, not a reconstruction at billing time.
The low-effort, high-impact starting point for most small businesses is a simple spreadsheet with the formula above, updated monthly. Once that habit is in place, moving to accounting software with job-costing features (QuickBooks Online, Xero, FreshBooks) adds automation without adding complexity. The goal is not a perfect accounting system on day one. It is a consistent, accurate gross margin figure you can act on.
If your business is at the point where inventory method selection, multi-state tax treatment, or a material inventory variance is on the table, that is the moment to bring in a professional. Punchvirtualmanager’s finance and accounting services are built for exactly that transition: businesses that have outgrown DIY bookkeeping and need structured financial clarity to support growth decisions.
Authoritative references and further reading
The following sources back the claims in this guide and provide deeper coverage for readers who want to go further.
- IRS Publication 538: The primary U.S. government source for inventory accounting methods, LIFO rules, and recordkeeping requirements. Start here for tax-specific guidance.
- Investopedia: Cost of Goods Sold (COGS): Clear definitions, formula breakdowns, and industry comparisons. Useful for foundational understanding and quick reference.
- Wall Street Prep: COGS: Practitioner-level coverage of journal entries, formula mechanics, and financial-statement context. Useful for accounting learners.
- AccountingTools: How to Calculate COGS: Step-by-step calculation guidance with notes on service businesses and cost-of-services-sold treatment.
- MDMS: Inventory Management System Examples: Practical inventory system examples for businesses considering FIFO or serialized tracking implementation.
- Punchvirtualmanager: Finance & Accounting Services: Professional accounting, tax, and virtual CFO support for businesses that need structured help with inventory accounting, method selection, or financial reporting.