
Checkout optimization directly converts your existing traffic into measurable revenue without spending another dollar on ads. For small businesses, that distinction is significant: a significant share of checkout abandonments are caused by unexpected costs like shipping, taxes, and fees appearing at the final step. Three business impacts stand out immediately:
- Immediate revenue lift: A small improvement in checkout completion rate produces substantial additional annual revenue from the same traffic.
- Lower marketing cost per acquisition: Every visitor you already paid to attract is worth more when your checkout converts them. Poor checkout wastes ad and SEO spend on traffic that never completes a purchase.
- Fewer support and operations costs: Transparent checkout reduces “where is my order” inquiries, payment disputes, and transaction errors.
Punchvirtualmanager works with South African small businesses and e-commerce retailers to identify and fix exactly these friction points, combining UX, digital marketing, and financial consulting in one engagement.
Table of Contents
- How does checkout friction translate into lost revenue?
- What are the primary causes of checkout abandonment?
- High-impact quick wins you can implement this week
- How do you measure checkout success and run useful tests?
- What operational benefits come from improving checkout?
- What does implementation typically cost and how long does it take?
- What mistakes should you avoid during checkout optimization?
- How does checkout optimization reduce cart abandonment beyond the checkout page?
- Key Takeaways
- Why checkout performance is a priority for Punchvirtualmanager
- Punchvirtualmanager can fix your checkout and grow your revenue
- Further reading and sources
How does checkout friction translate into lost revenue?
The math is straightforward. Checkout completion rate measures the percentage of shoppers who start the checkout process and actually finish it. Industry benchmarks typically place this rate at less than two-thirds for small e-commerce stores, meaning up to half of shoppers who intend to buy never complete the transaction.

Consider a simple example:
| Input | Value |
|---|---|
| Monthly checkout starts | 1,000 |
| Average order value (AOV) | $50 |
| Current completion rate | 50% |
| Completion rate after 10-point lift | 60% |
| Additional annual revenue | $60,000 |
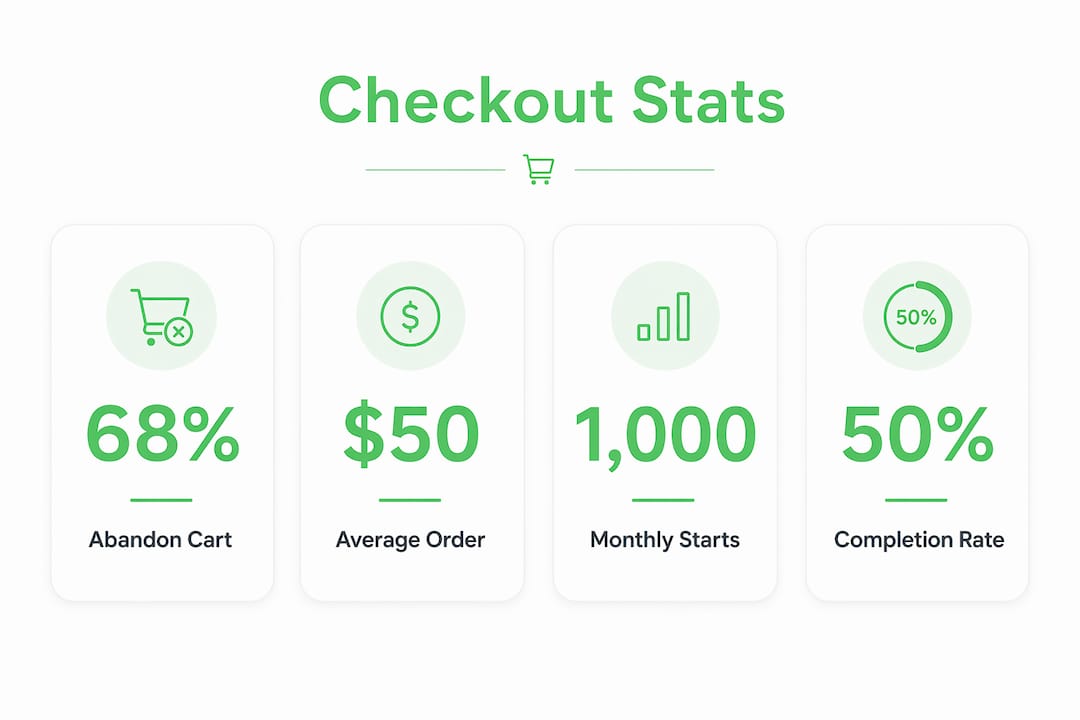
A 10-percentage-point lift on 1,000 monthly checkout starts at a $50 AOV produces $60,000 in additional annual revenue. No extra traffic, no higher ad budget. That is the core case for checkout optimization improving sales.
Three factors amplify this further:
- Higher-AOV stores see proportionally larger gains from the same percentage lift.
- Mobile traffic, which commonly accounts for 60–75% of visits, converts 15–20 percentage points lower than desktop, so mobile fixes carry outsized returns.
- Checkout improvements multiply the value of every marketing dollar already being spent on Google Ads, SEO, and social campaigns.
What are the primary causes of checkout abandonment?
Ranked by frequency and ease of fix, the leading causes are:
- Unexpected costs (shipping, taxes, fees): 48% of abandonments trace back to costs that appear only at the final step. Fix type: policy and UX (show totals earlier). Lowest effort, highest return.
- Forced account creation: A notable portion of abandonment instances are linked to mandatory registration. Fix type: UX (enable guest checkout). Fast to implement on most platforms.
- Long or complex forms: Too many fields increase cognitive load and drop-off. Fix type: UX (reduce fields, use autofill). Moderate effort.
- Limited payment methods: Shoppers who cannot pay their preferred way leave. Fix type: technical (add wallet payments). Moderate effort with strong mobile ROI.
- Mobile UX and technical failures: Slow load times, unresponsive buttons, and poorly sized form fields disproportionately affect mobile users. Fix type: technical. Higher effort but high return given mobile traffic share.
Pro Tip: Fixing unexpected costs and guest checkout alone addresses the two most common abandonment reasons and typically requires no custom development on platforms like Shopify or WooCommerce.
High-impact quick wins you can implement this week
These fixes are ranked by speed of implementation and expected conversion lift:
- Enable guest checkout. Remove mandatory account creation before purchase. On most platforms, this is a single settings toggle. Post-purchase, prompt buyers to save their details as an account.
- Display the full cost before checkout begins. Show shipping estimates and taxes on the cart page, not just at the payment step. This addresses the single largest abandonment cause directly.
- Add one or two express payment options. Apple Pay and Google Pay can lift mobile conversion substantially according to industry reporting. Both integrate with Shopify, WooCommerce, and most major platforms within hours.
- Reduce form fields to essentials. Remove fields that are not required to fulfill the order. Use address autocomplete where available.
- Add visible trust signals. Display security badges, accepted payment logos, and a brief return policy summary near the payment button.
- Make the return policy visible. Shoppers who can see the return policy before paying are more likely to complete the purchase.
Pro Tip: Post-purchase account creation, where you invite buyers to save their details after the order confirms, converts a meaningful share of guest buyers into registered accounts without blocking the sale.
Better checkout design alone can significantly lift conversions for many sites, according to meta-analysis benchmarks. These quick wins are where that gain starts.
How do you measure checkout success and run useful tests?
Tracking the right metrics prevents you from optimizing the wrong thing. The essential metrics are:
- Checkout starts: Total sessions that enter the checkout flow.
- Checkout completion rate: Completed orders divided by checkout starts.
- Step-level drop-off: The percentage of users who exit at each specific step (cart, shipping, payment, confirmation).
- Revenue per visitor (RPV): Total revenue divided by total site visitors. This is the single metric that captures both traffic quality and checkout performance together.
- Recovered cart revenue: Revenue attributed to cart abandonment email or retargeting sequences.
| Metric | How to track | Target action |
|---|---|---|
| Checkout completion rate | Google Analytics 4 funnel report | Identify lowest-completion step |
| Step-level drop-off | GA4 checkout funnel or platform reports | Fix the highest-exit step first |
| RPV | Revenue ÷ sessions in GA4 | Benchmark before and after each change |
| Recovered cart revenue | Email platform or retargeting workflow | Measure recovery rate monthly |
For A/B testing, Stripe’s merchant guidance recommends a measurement-first approach: test one change at a time, define a hypothesis before you start, and run each test for at least two to four weeks to reach statistical reliability. A useful hypothesis format: “Enabling guest checkout on the account-creation step will increase checkout completion rate by at least 5 percentage points over 30 days.”
Tracking digital marketing metrics beyond approval rates is where most small businesses find the real performance gap.
What operational benefits come from improving checkout?
Revenue is the headline, but the operational gains are equally real. A unified commerce benchmark found that moving to higher checkout maturity unlocks measurable reductions in fulfillment costs alongside revenue gains.
- Fewer “where is my order” inquiries: When checkout clearly communicates delivery dates and shipping costs, customers have fewer reasons to contact support.
- Lower payment disputes: Accurate cost disclosure at checkout reduces chargebacks and billing confusion.
- Fewer transaction errors: Simplified forms and validated fields reduce incorrect addresses and failed deliveries.
- Improved staff productivity: With fewer support tickets and order corrections to handle, staff can focus on inventory management and higher-value tasks.
- Better revenue forecasting: Consistent checkout data makes monthly revenue more predictable, which supports financial forecasting and cash flow planning.
A conservative estimate: if a store handles 20 support inquiries per week related to order confusion and each takes 15 minutes to resolve, reducing that by half saves roughly 2.5 staff hours per week, or over 100 hours annually.
What does implementation typically cost and how long does it take?
Timeline bands:
- Quick fixes (1–2 weeks): Guest checkout, cost transparency, trust signals, return policy placement. Typically handled by a site admin with no custom code.
- Platform configuration and payment integrations (2–6 weeks): Adding wallet payments, address autocomplete, and step-level analytics. Requires platform familiarity and some technical setup.
- Custom development (4–12+ weeks): Custom checkout flows, dynamic shipping calculators, personalized payment options. Requires a developer or agency.
Cost ranges:
- DIY (owner-managed): $0–$200 for plugin licenses or platform add-ons. Time cost is the primary variable.
- Platform-configured (freelancer or specialist): $500–$2,500 depending on platform complexity and number of integrations.
- Agency-assisted: $2,500–$10,000+ for a full checkout audit, implementation, and testing cycle. Cost rises with custom development, payment gateway complexity, and ongoing retained support.
Choose an agency or retained consultant when the revenue opportunity (use the calculation above) clearly exceeds the implementation cost, or when in-house technical capacity is limited. Mobile marketing priorities often make mobile checkout fixes the highest-ROI starting point for most small businesses.
What mistakes should you avoid during checkout optimization?
- Wholesale redesign without testing: Replacing the entire checkout flow at once makes it impossible to identify which change caused a drop or lift. Detection tip: if your completion rate changes sharply after a launch, you cannot isolate the cause.
- Adding too many payment options: More than five or six payment methods can create decision paralysis. Detection tip: check if payment-step drop-off increases after adding new options.
- Hiding shipping costs until the final step: This is the leading abandonment cause. Detection tip: compare drop-off rates at the payment step versus the cart page.
- Over-promising delivery dates: Inaccurate delivery estimates generate support tickets and damage repeat purchase rates. Detection tip: track the gap between promised and actual delivery dates monthly.
The safeguard is simple: test one change at a time and monitor step-level drop-off before and after each change. Automated post-abandonment workflows can recover some lost revenue while you fix the root causes, but they do not replace fixing the checkout itself.
How does checkout optimization reduce cart abandonment beyond the checkout page?
Cart abandonment often starts before a shopper reaches the checkout flow. Pre-checkout UX influences, including product page clarity, cart page design, and site speed, all affect whether a shopper even begins checkout. Displaying accurate shipping cost estimates on the product or cart page, rather than waiting until the payment step, removes the most common abandonment trigger before it becomes a checkout problem.
Clear return policies and delivery date estimates on product pages reduce hesitation at the point of decision. Shoppers who already know the return window and expected delivery date are less likely to abandon when they reach checkout. Remarketing campaigns that re-engage shoppers who viewed a product but never started checkout address abandonment even earlier in the funnel.
Marketing automation workflows that trigger based on cart activity, such as a reminder email 30 minutes after cart abandonment, complement checkout fixes by recovering shoppers who left despite a well-optimized flow. Tracking client acquisition KPIs alongside checkout metrics gives a fuller picture of where revenue is being lost across the full funnel.
Key Takeaways
Checkout optimization is the highest-leverage revenue action a small business can take without increasing traffic spend.
| Point | Details |
|---|---|
| Show total cost early | Display shipping and taxes on the cart page to address the leading abandonment cause. |
| Enable guest checkout | Remove mandatory account creation to recover the second-largest abandonment segment. |
| Add wallet payments | Apple Pay and Google Pay can lift mobile conversion substantially with minimal setup time. |
| Measure step-level drop-off | Track where shoppers exit the checkout flow before optimizing any individual step. |
| Punchvirtualmanager as partner | Punchvirtualmanager combines UX, digital marketing, and financial consulting to implement and measure checkout improvements for South African small businesses. |
Why checkout performance is a priority for Punchvirtualmanager
Most small businesses focus their optimization energy on driving more traffic. That is understandable, but it misses the larger opportunity. A store converting 50% of checkout starts and spending $3,000 per month on Google Ads is effectively discarding half the value of that budget at the final step. Fixing checkout first makes every subsequent marketing investment more productive.
Punchvirtualmanager’s approach combines three disciplines that most agencies treat separately: digital marketing, website UX and development, and financial consulting. Checkout sits at the intersection of all three. A payment integration decision affects both conversion rate and cash flow timing. A shipping cost policy affects both abandonment rate and gross margin. Treating these as isolated problems produces isolated fixes. Treating them together produces compounding gains.
The agency’s 99% advertising success rate reflects this integrated approach. Clients who improve checkout performance alongside their paid media campaigns see their cost per acquisition fall without reducing ad spend, because the same traffic converts at a higher rate.
— Steel
Punchvirtualmanager can fix your checkout and grow your revenue
Punchvirtualmanager gives South African small businesses a single point of contact for the three disciplines checkout optimization actually requires: website development and UX fixes, digital marketing and paid media management, and financial forecasting tied to revenue improvements.

Rather than coordinating a developer, a marketer, and an accountant separately, clients work with one team that understands how a checkout change affects both conversion rate and monthly cash flow. Services relevant to checkout improvement include website UX audits and development, payment gateway integration, Google Ads and SEO management, and virtual CFO support for revenue forecasting.
If your checkout completion rate is below 50% or your mobile conversion lags desktop by more than 15 points, there is a quantifiable revenue opportunity waiting. Review the digital marketing packages or explore the full website development and support services to take the next step.
Further reading and sources
- 9 Checkout Optimization Best Practices (Data-Backed) — Primary source for the 48% unexpected-cost abandonment stat and the 26% forced-account-creation figure.
- Checkout Optimization for Ecommerce: 15 Fixes That Lift Conversion — Source for completion rate benchmarks, mobile conversion gap data, and wallet payment lift figures.
- 12 Ecommerce Checkout Optimizations Ranked by Conversion Impact — Meta-analysis benchmarks for potential conversion lift from checkout design improvements.
- Checkout Optimization Tips for Ecommerce Businesses — Stripe’s merchant guidance on A/B testing methodology and step-level measurement.
- Closing the Checkout Gap: Boosting Revenue and Customer Loyalty — Unified commerce benchmark linking checkout maturity to revenue and fulfillment cost improvements.
- The Checkout Performance Gap — Industry analysis of how traditional reporting misses early-funnel drop-off and the revenue cost of checkout friction.